What millions of Claude conversations reveal
Anthropic studied how people actually use AI, hour by hour. This is my write-up of the bits worth knowing.
The original study: Anthropic Economic Index — State of AI in Business, June 2026. Published 26 June 2026. All charts below are Anthropic's, from the report.
What this is
Anthropic (the company behind Claude) periodically studies how people actually use AI — millions of real conversations, analysed for patterns. Not a survey about what people say they do: the actual rhythm of what they ask, when they ask it, and what they ask for.
The result is the closest thing we have to a picture of how AI has actually settled into everyday life. And the headline is: we're all creatures of habit — the same needs, at the same times, nearly everywhere.
The day, hour by hour
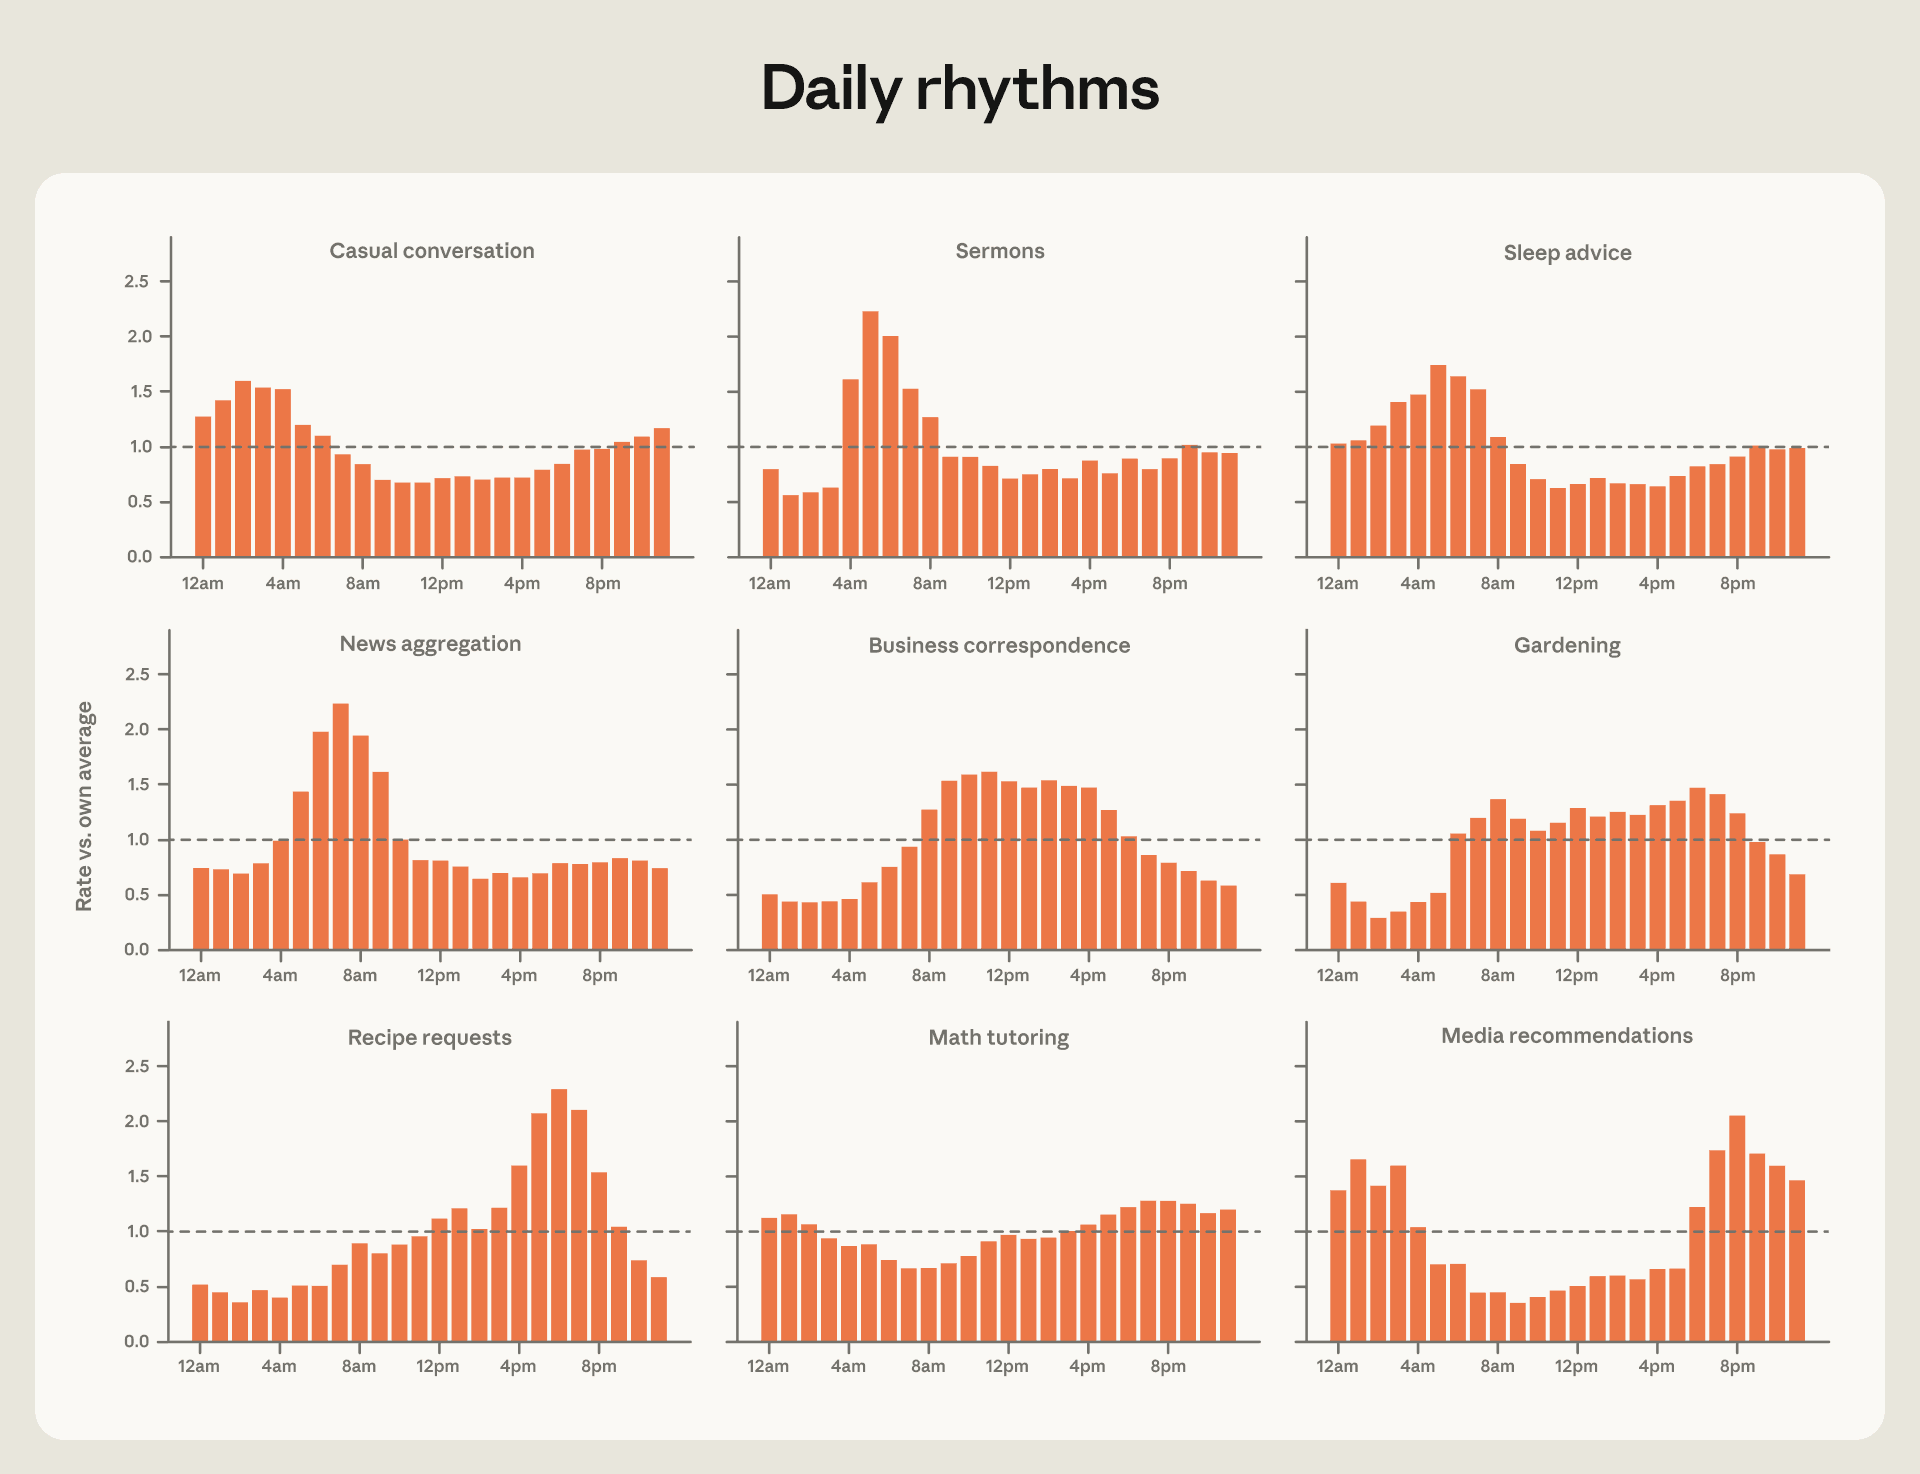
Each chart below shows when a type of request runs above or below its own daily average. Read it as a clock:
- 5amthe people who can't sleep are asking for sleep advice — and, weirdly, sermons peak before dawn too.
- 7ameveryone wants the news. The sharpest morning spike on the board.
- 9am to 4pmbusiness correspondence, all day, every day — the shape of the working day drawn in emails.
- After schoolmaths tutoring starts climbing. That's the homework crowd.
- 6pmwhat's for dinner? Recipe requests run at more than twice their daily average.
- 9pmwhat should I watch tonight? Media recommendations spike.
- Past midnightit's just chat — casual conversation creeps up as the world goes quiet.
The week: work Claude and weekend Claude
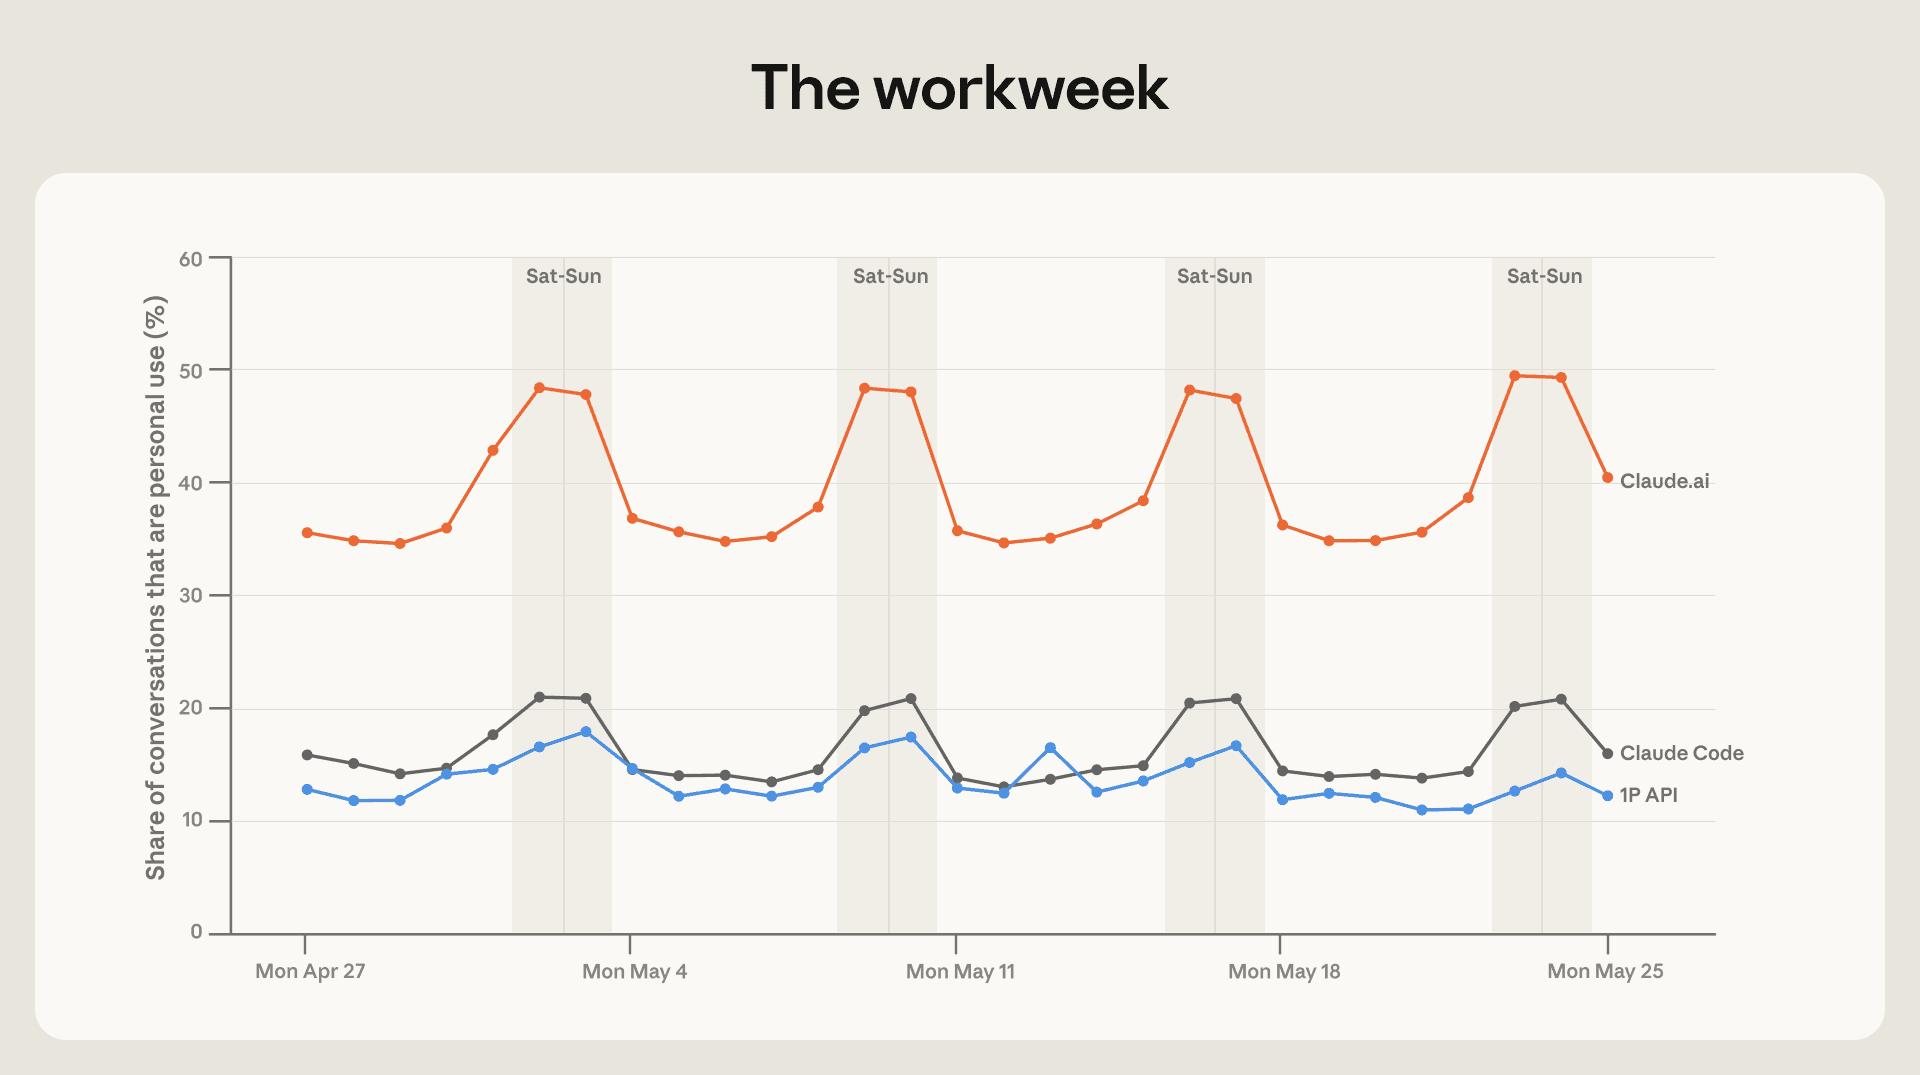
On weekdays, about a third of conversations are personal. At the weekend it climbs to nearly half — and the mix shifts toward emotional support, health questions and personal finance. When the work pressure comes off, people get honest with it.
Who's still working at midnight
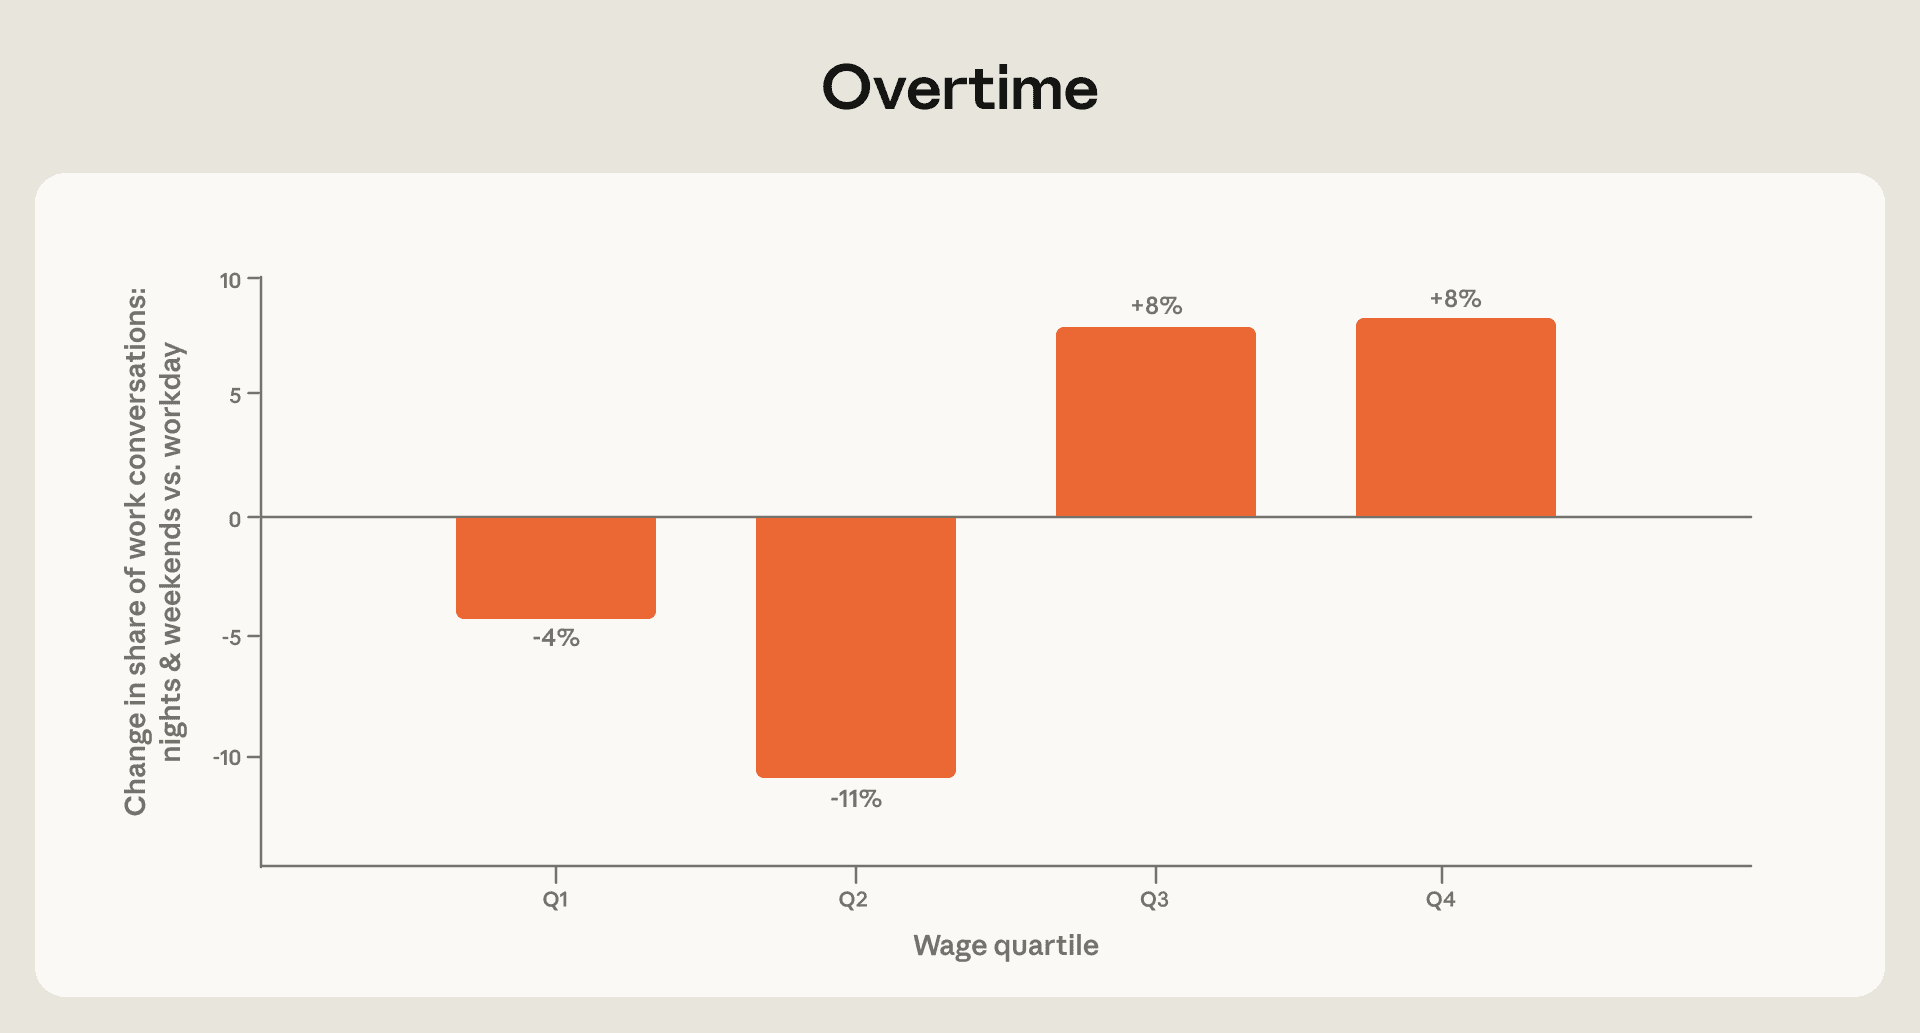
When work conversations happen at nights and weekends, they skew toward the higher-paid occupations: the top two wage quartiles do relatively more of their AI-assisted work out of hours (+8%), while the lower quartiles do less. Make of that what you will — the better paid you are, the more the work follows you home.
Nothing reveals humanity like a deadline
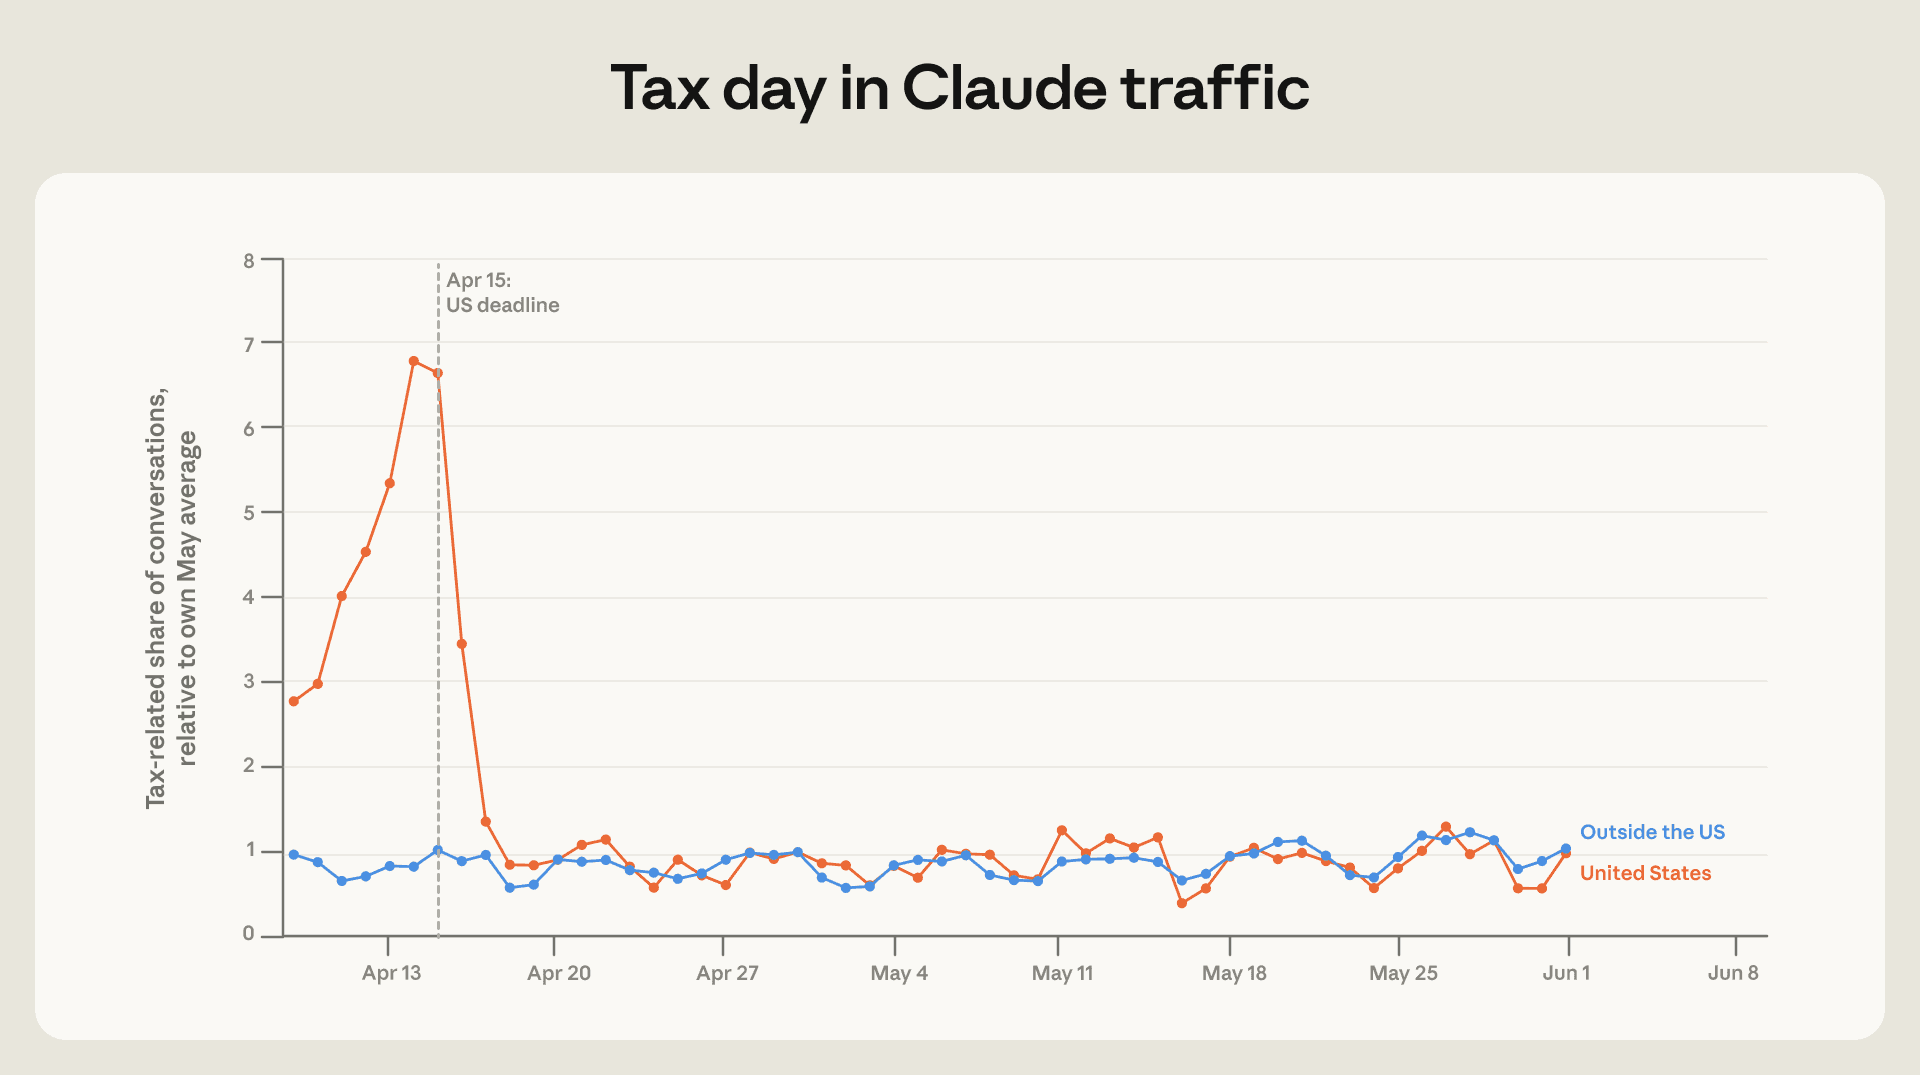
In the run-up to the April 15 US tax deadline, tax-related conversations in the US spiked to roughly seven to eight times their normal share — and collapsed back to normal the day after. Outside the US: nothing. A national deadline, drawn in AI traffic.
And what do people actually get out of it?
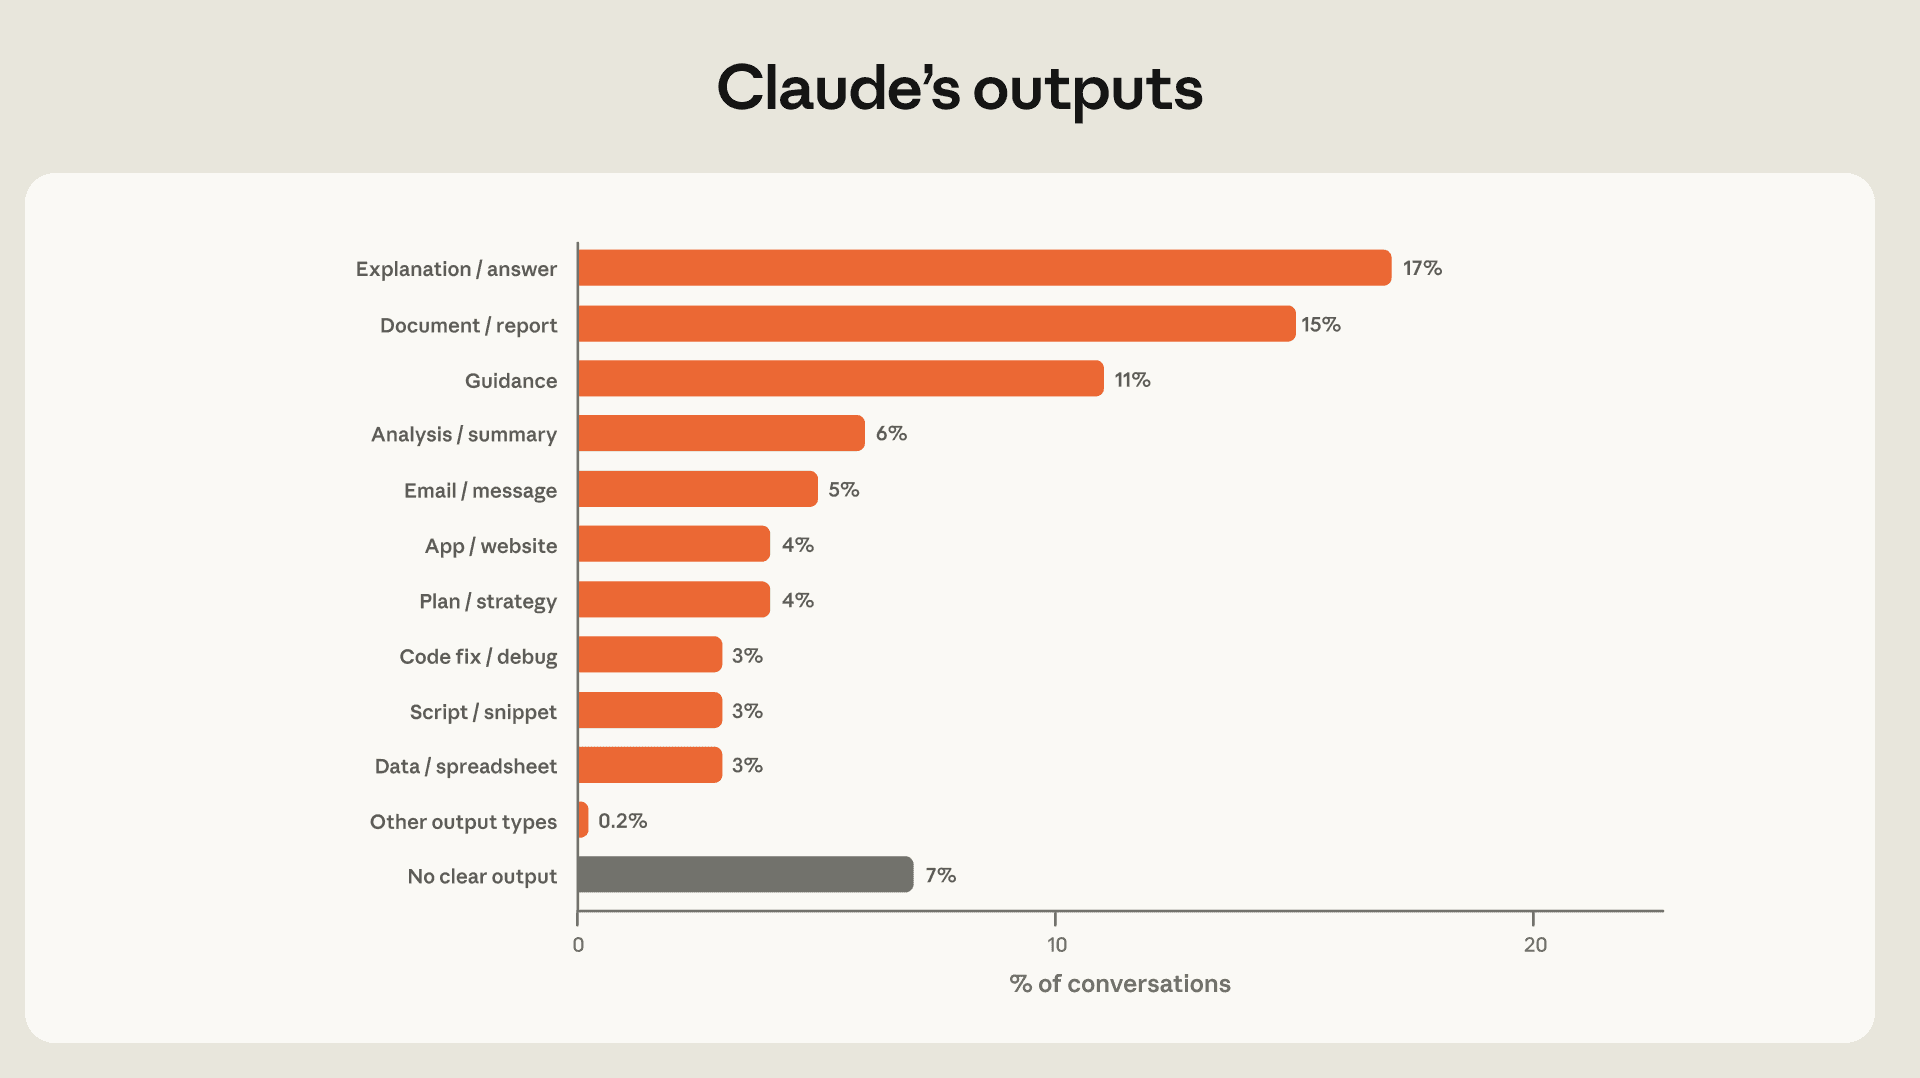
The report's other quiet headline: 93% of conversations produce something — an explanation, a document, a plan, a piece of code. People aren't chatting with AI for the sake of it; they leave with an output. The biggest categories: explanations (17%), documents and reports (15%), and guidance (11%).
How they know this without reading your chats
No human reads the conversations. In the report's own words, the analysis is based on privacy-preserving classifiers where “transcripts are only read by another instance of Claude” — an automated system samples a slice of conversations, anonymised, and labels the patterns. The report is built from those aggregate patterns, never from individual chats.
The honest caveats: this is consumer Claude usage (the app and Claude Code), so it won't perfectly describe every tool or workplace — and the time-of-day charts show each request type against its own average, not how big each category is overall. I care about privacy more than most; here's my full breakdown of what AI companies actually do with your chats.
How people feel about AI
The report's second half asked millions of people what they expect AI to do to their jobs. The finding that stuck with me wasn't about fear.
What people actually expect
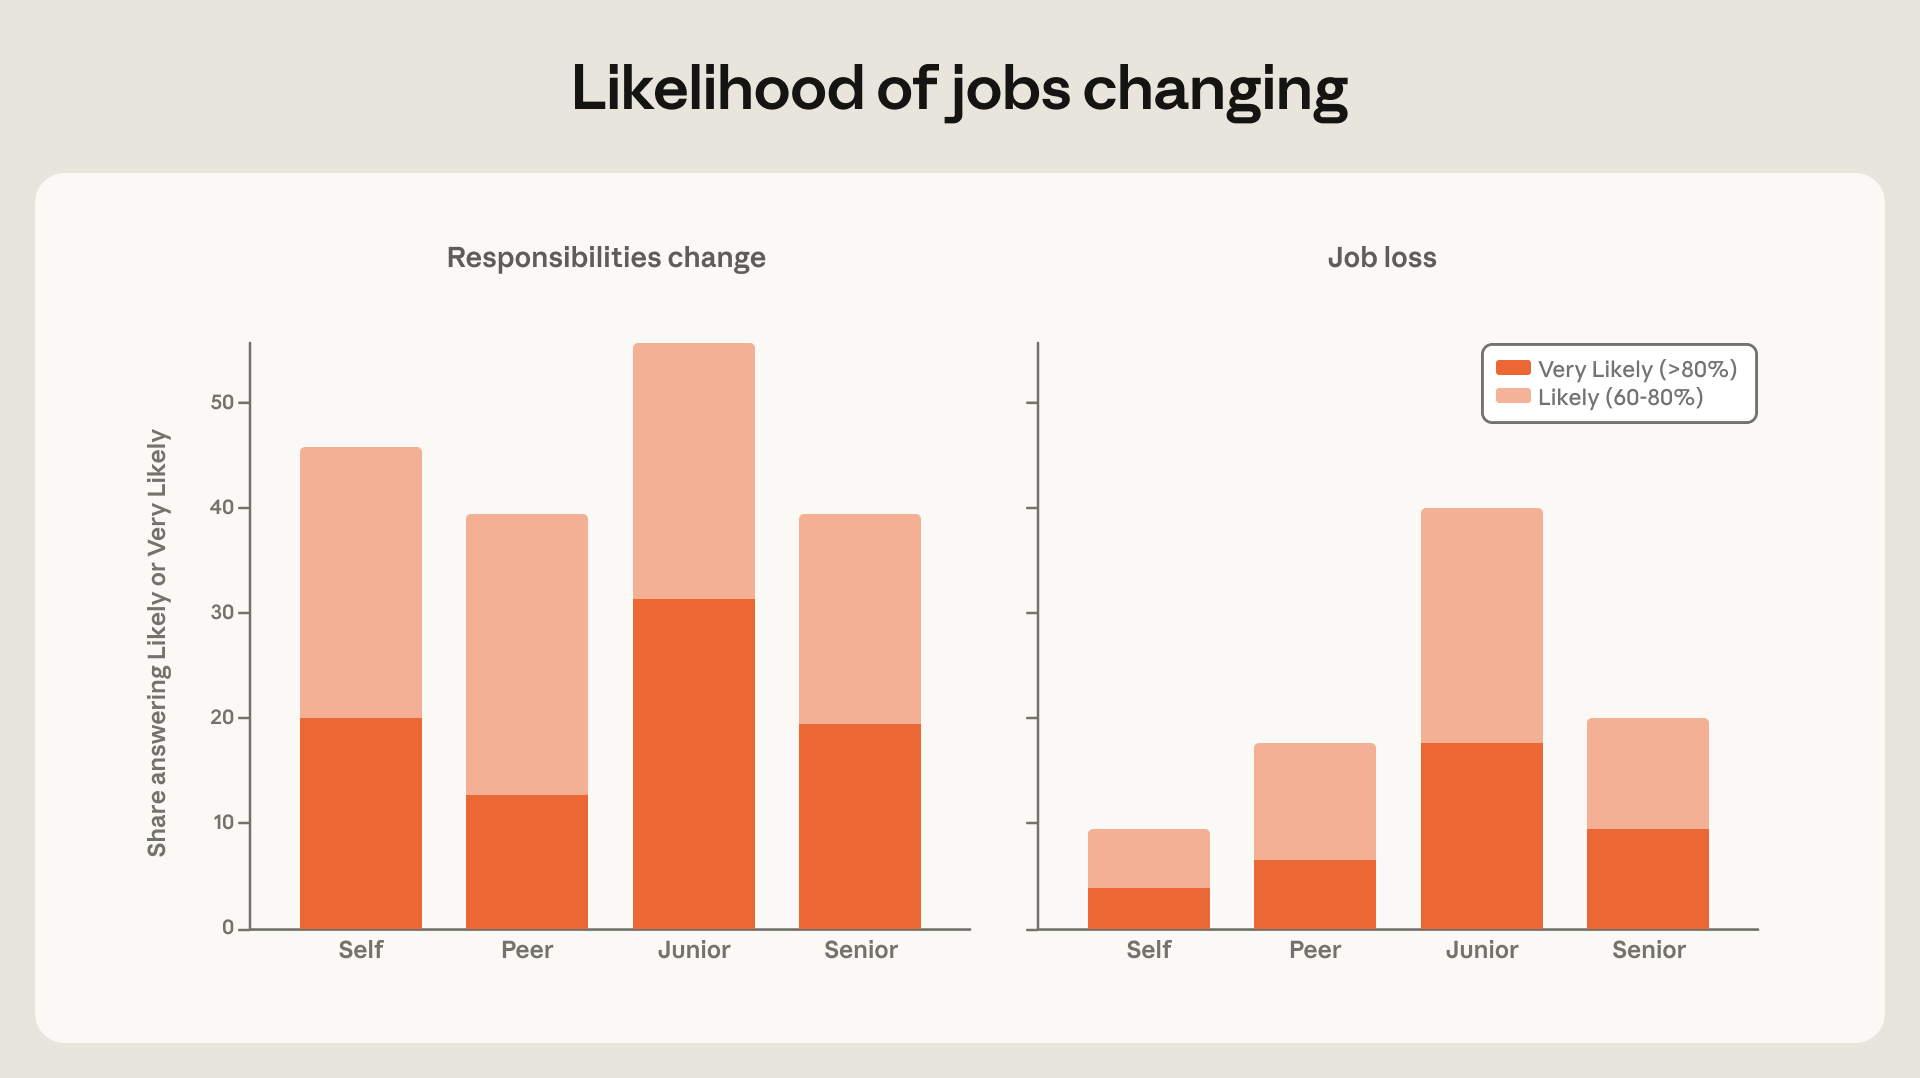
Start with the fear, because it's not where you'd guess. Only about one in ten people think it's likely their own job is gone within the year. The worry is real, but it's pointed at someone else: more than a third think it's likely for the junior roles — the person you'd have hired two years ago.
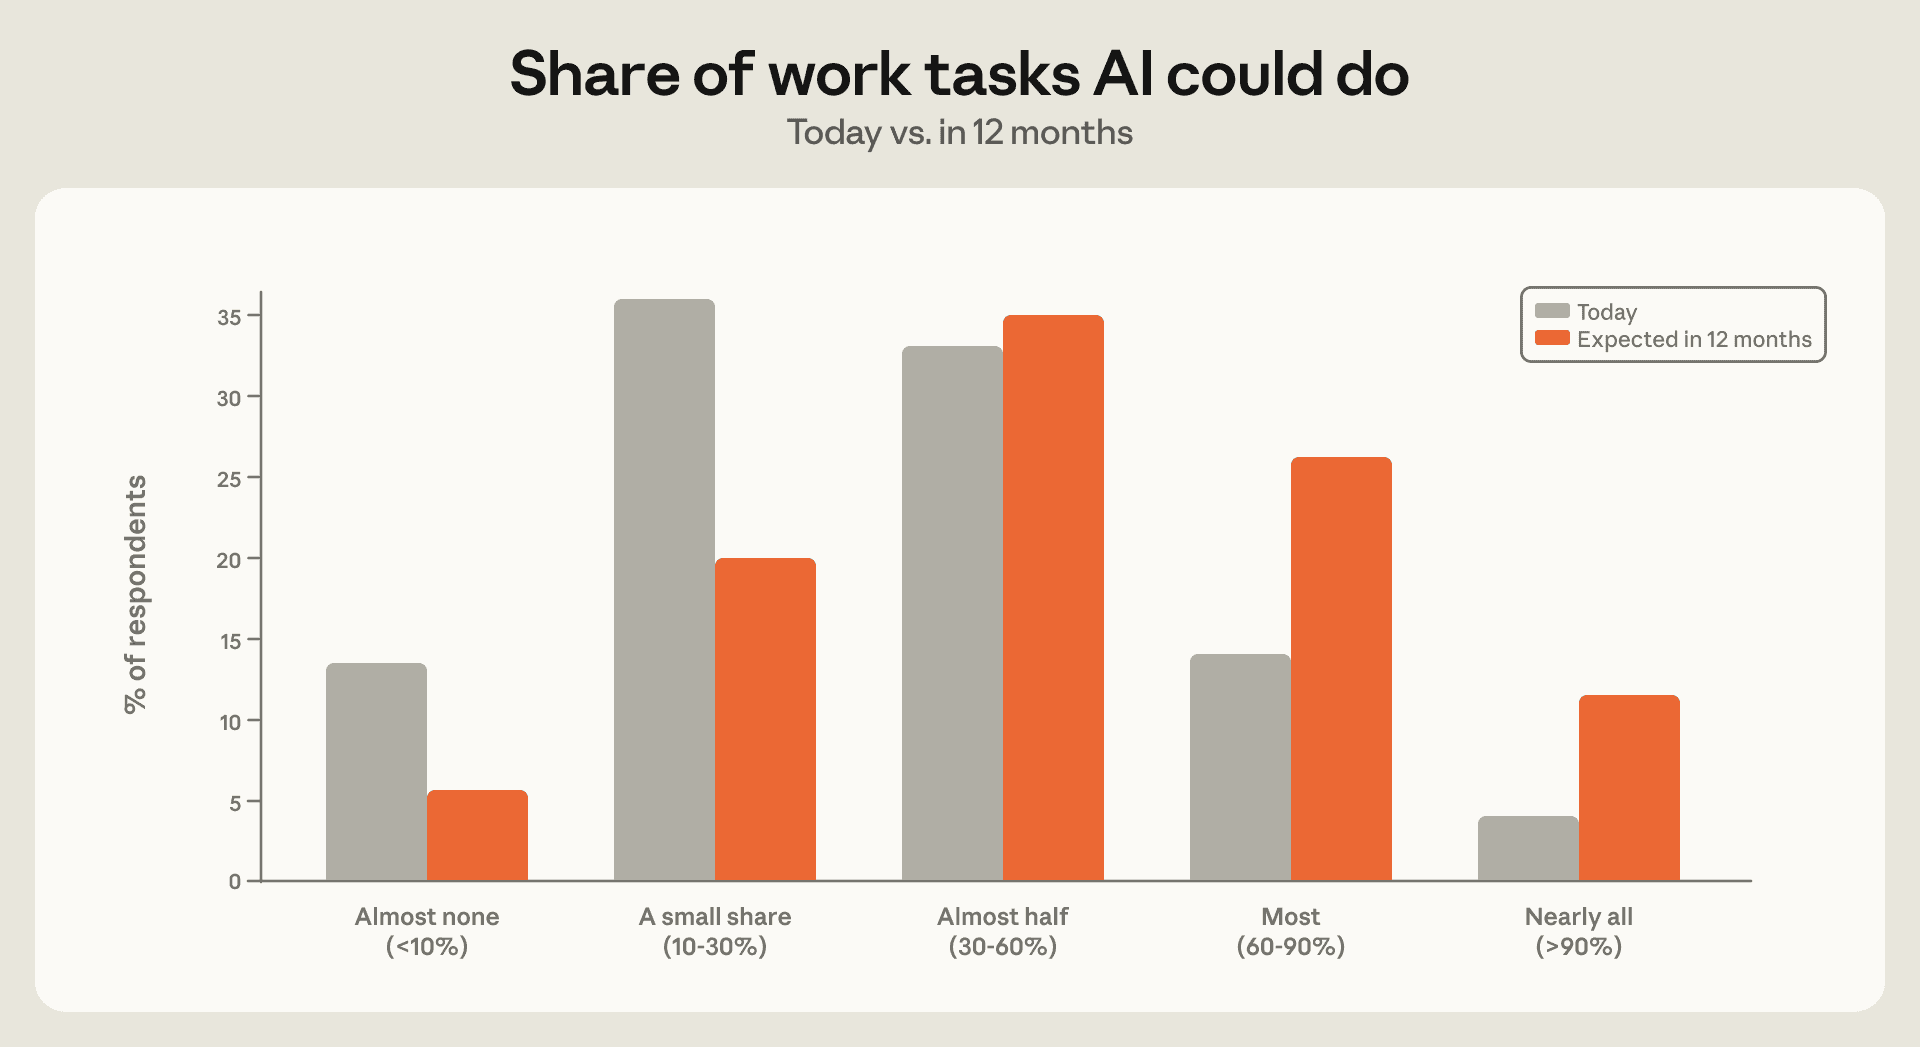
And it's moving. Today most people say AI can do a small share of their work — but asked about twelve months from now, the whole distribution shifts right. Over a third expect it to handle most or nearly all of their actual job tasks within the year.
The finding that surprised me
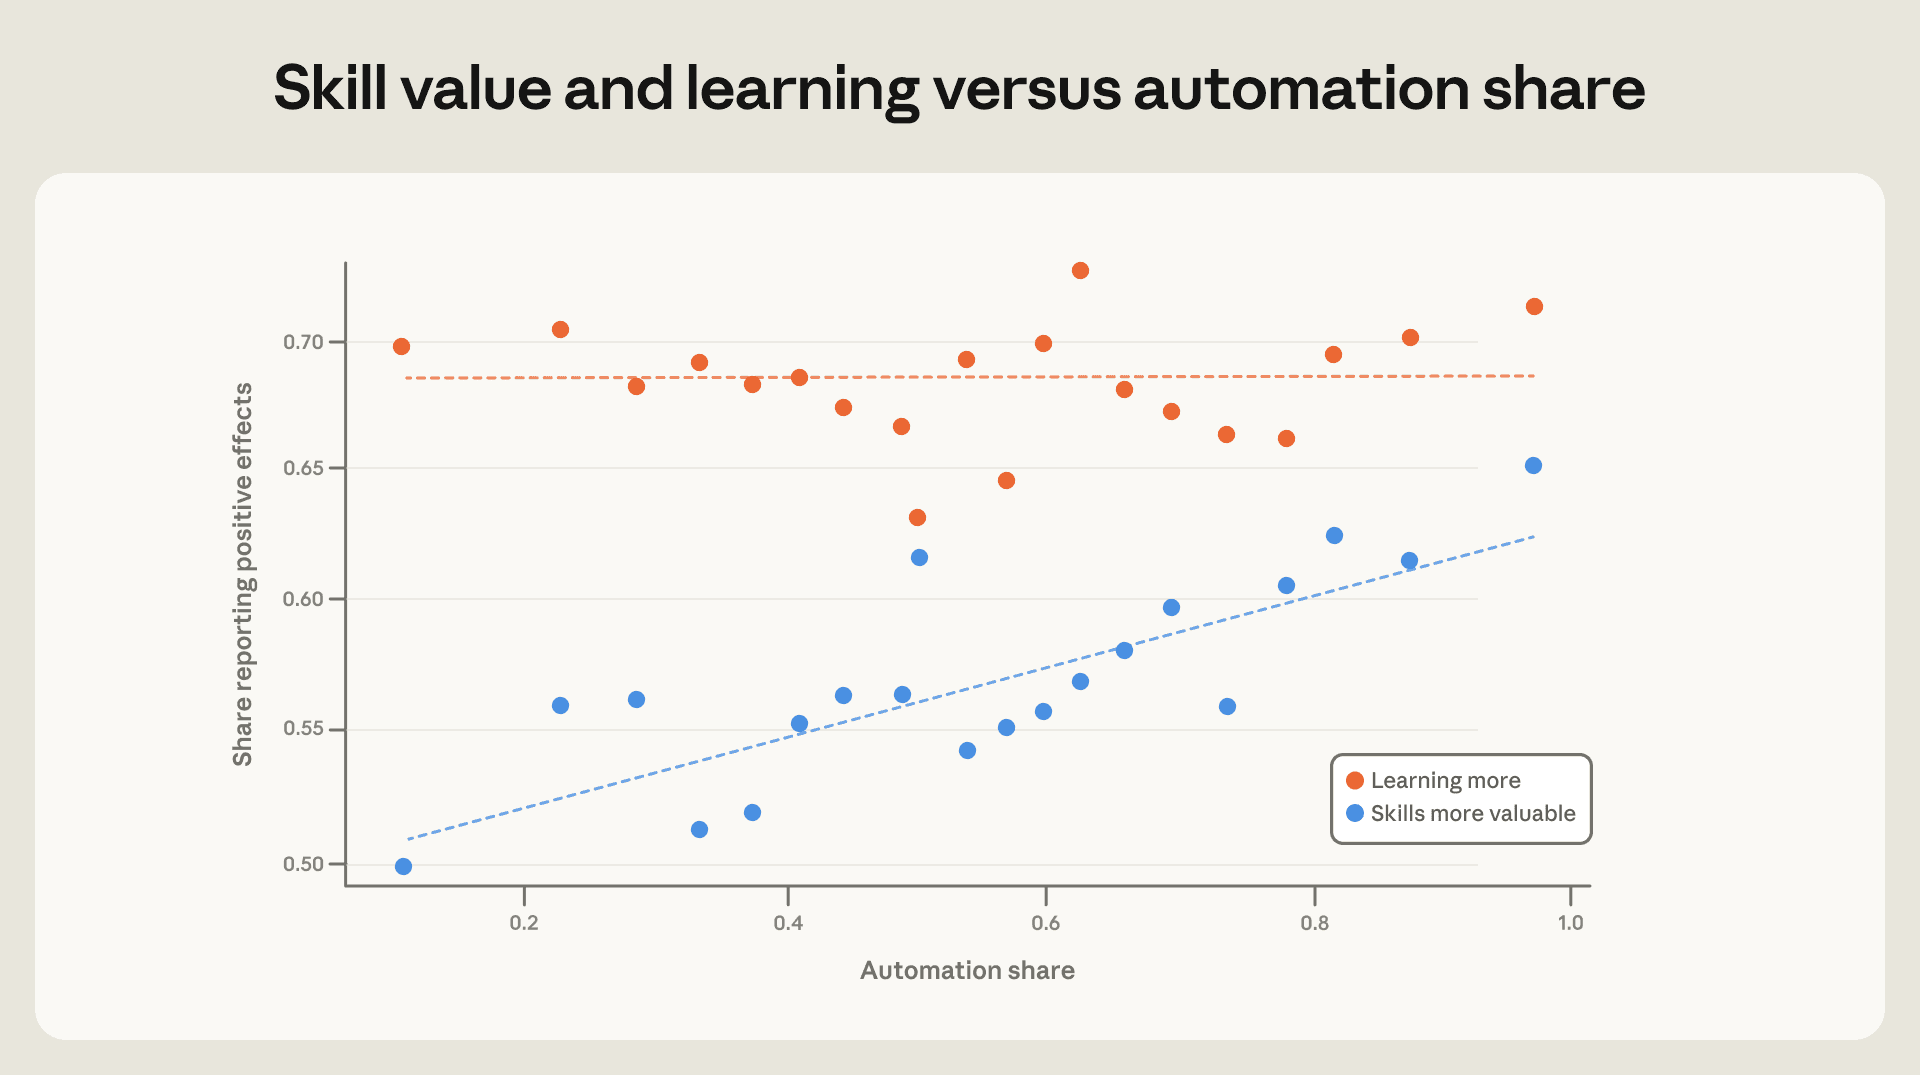
Here's the bit I didn't expect. You'd assume the people handing the most work to AI would be the most nervous about it. It's the opposite. The more of their work people delegate to Claude, the more optimistic they are about their own careers — across pay, job security, finding a job, meaning and autonomy. Every dimension goes up with how much they hand over.
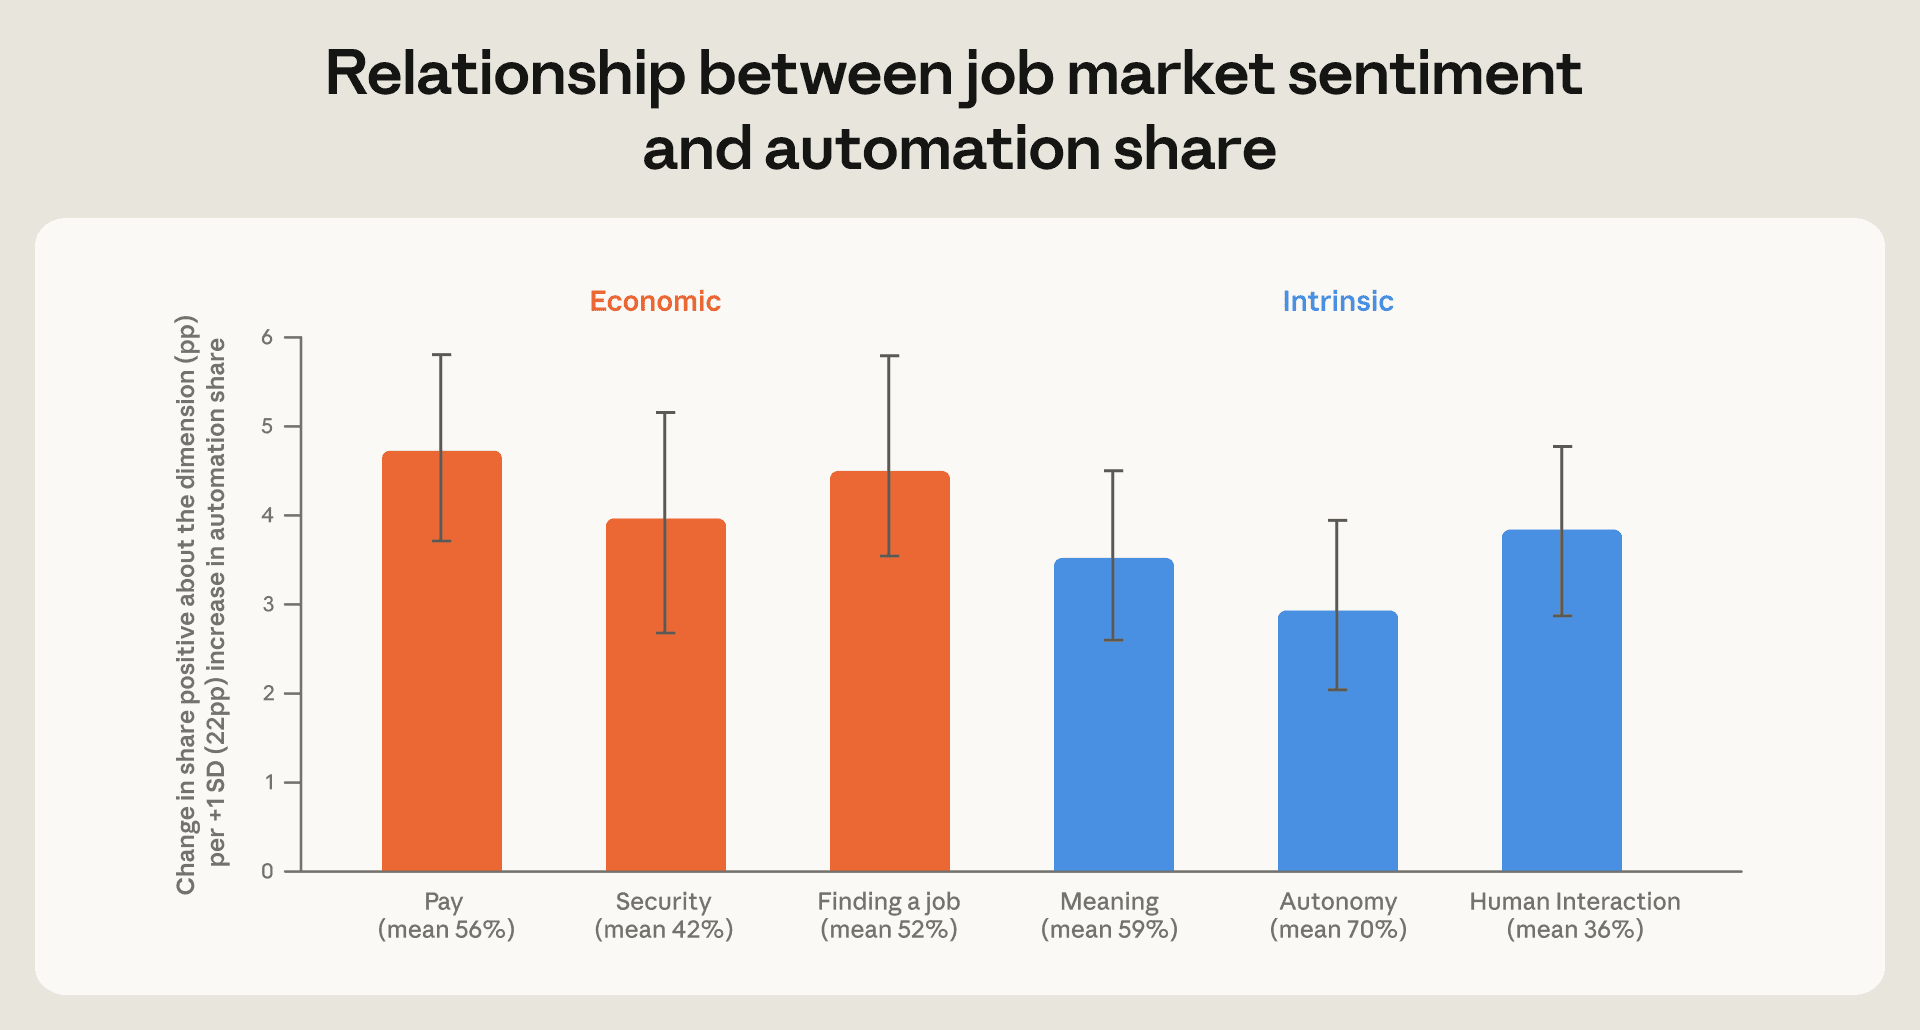
It's not blind optimism either. The same heavy users are the ones who reckon their own skills are getting more valuable, not less — the blue line climbs the more they delegate. Handing work to AI isn't making them feel replaceable. It's making them feel worth more.
Why that happens
When you actually use AI on real work, you find out where the line is — what it's genuinely good at, and what it's still rubbish at. That knowledge is what turns into confidence. You stop guessing and start knowing, so the future feels like something you can steer rather than something happening to you.
If you're watching from the sidelines, you never get that. You fill the gap with fear instead. That's the real split in the data — it isn't people's job title or their age that decides whether they're calm or scared. It's whether they've actually started.
The one move
So if you take one thing from all of this: pick a real task this week — something actually off your plate, not a toy — and properly hand it over. Being on the “started” side of that line is the whole difference. Here's a prompt that picks the task with you and walks you through the first one. Paste it in and answer its questions.
When one task turns into wanting your whole business ready for this, that's a bigger job — here's where I'd start.
One honest caveat
This half of the report is a survey, and it leans toward people who are already using AI. So read it as how the early adopters feel, not the whole population — the optimism could partly be the kind of people who lean in early. I still think it's the more useful signal: if you want to know where this goes, the people already doing it are exactly the group I'd be watching.
Want to get better at this?
Let's set up your agent ecosystem.
This page is one job. The whole thing is a set of them running off the same foundation, the folder your AI works out of, the brief on how you like things done, the accounts it can reach and the skills that run off all of it, so your admin gets done the way you would do it. It is what I teach one to one, on your own machine and against your own work, and the quickest way to find out what yours would look like is a proper chat about it.
Not ready for a call? Start with the free agent series, what an AI agent actually is, and build up from there.